The ABCs of MPPT
What You Need to Know About Maximum Power Point Tracking
Maximum Power Point Tracking or MPPT is an important technical function you need to have a grasp of to understand how PV plants turn the sun’s rays into clean energy. MPPT is a term that is discussed often in the alternative energy space though is actually not truly understood by many. In this blog, we seek explain this concept in a manner that is easy to understand for both technical and non-technical readers. The article will help you grasp what MPPT actually does, how it works and how different types of PV power electronics use MPPT algorithms to maximize energy production from solar panels.
Let’s start with a definition: MPPT is the algorithm by which the power electronics connected to a PV panel, a row of PV panels (as string) or a number of PV strings (an array) extracts the maximum amount of power from those PV panels. PV panels will only produce power when exposed to sunlight and connected to a load such as an inverter or DC-DC optimizer. Those devices will “load” the PV panels and using the MPPT algorithms in their onboard firmware (the software installed on the microcontrollers on the devices circuit boards) will vary their loading to determine the operating voltage which allows the maximum amount of power to be harvested from the PV module, string or array. This operating voltage will correspond to the output voltage of the PV panels to which the device is connected. In the case of a piece of module level power electronics such as a microinverter or module level DC-DC optimizer, that will be the panel’s operating voltage. In the case of string level device like Alencon’s SPOT or a string inverter, that will be voltage the of all the panels in the string, as panels in a string are connected in series. The same is true of the array, as the strings in the array are connected in parallel. (Quick electrical note: When electronic devices are connected in series, the voltage adds up and the current doesn’t change. When connected in parallel, currents add up and voltages don’t change).
The IV Curve – the Basis of MPPT
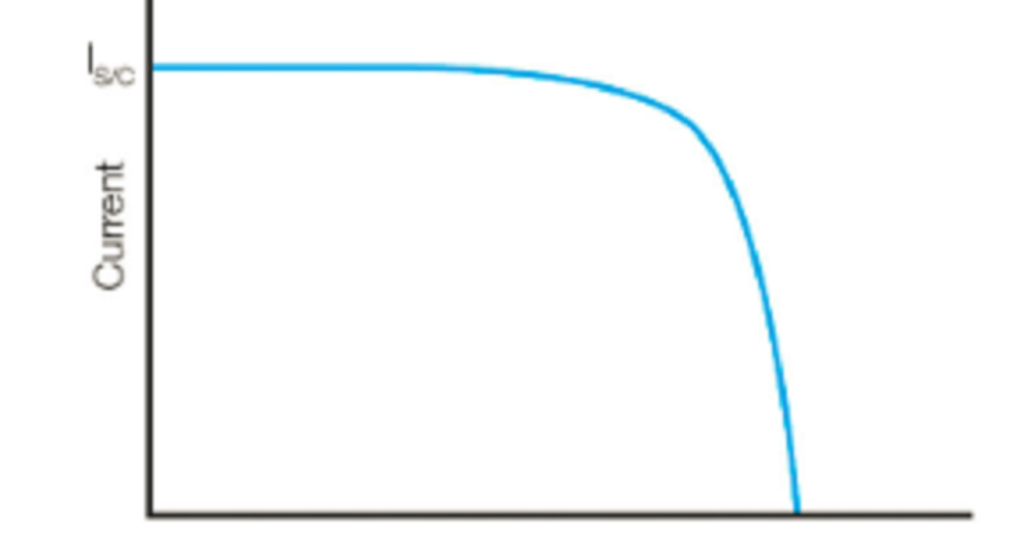
To truly understand what MPPT is doing, you need understand the concept of an IV curve, or a plot of current (I) versus voltage (V) at different levels of irradiance. These curves are typically found on the spec sheets for PV panels and show the current a PV panel generates at each corresponding voltage level. A typical PV panel IV curve is shown below on the left.
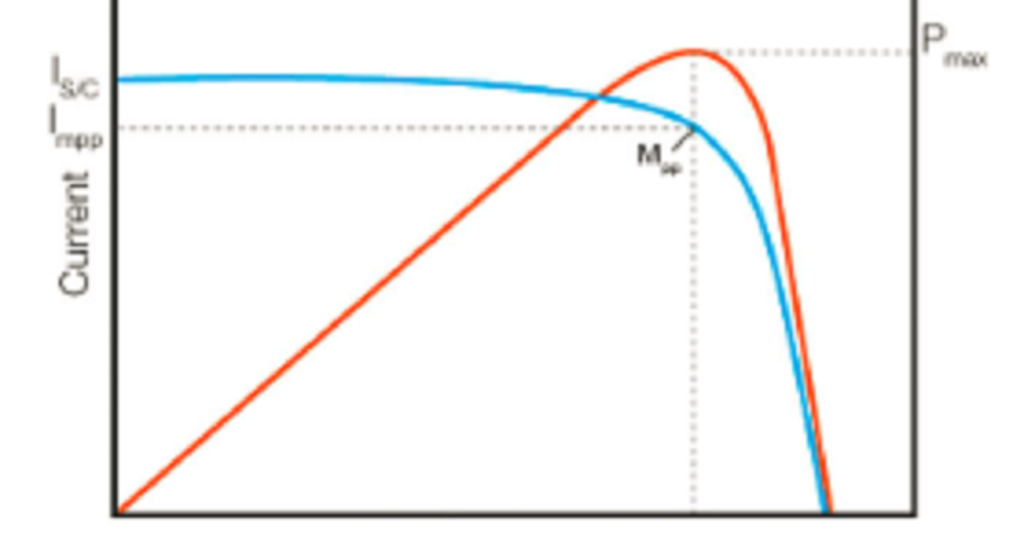
The maximum power point or MPP is derived from these curves as the levels of voltage and current that generate the highest amount of power, as power is the product of voltage times current. From the IV curves, you can then plot an MPP curve, where the vertical axis is now power and the horizontal axis is voltage. Thus, from these curves you can ascertain that the job of an MPPT algorithm is to determine what level of voltage should be loaded to achieve the maximum power output from the PV panel. The MPP is shown in the diagram on the right.
The MPPT Function
As explained above, the MPP is the point on the plot of voltage and power that is highest. Thus, it is the role of the MPPT to determine this point. The MPPT does so by iterating the voltage being loaded onto the PV panels until it sees the maximum amount of power has been generated. There are many well defined methods for doing so, including the most common which is known as “perturb and observe.” In this approach, the power electronics changes the level of voltage loading and reads the level of power. The device iterates or loops until it converges on the level of voltage that produces the highest level of power.
The Choice of MPPT Granularity and the Problem of PV Panel Mismatch
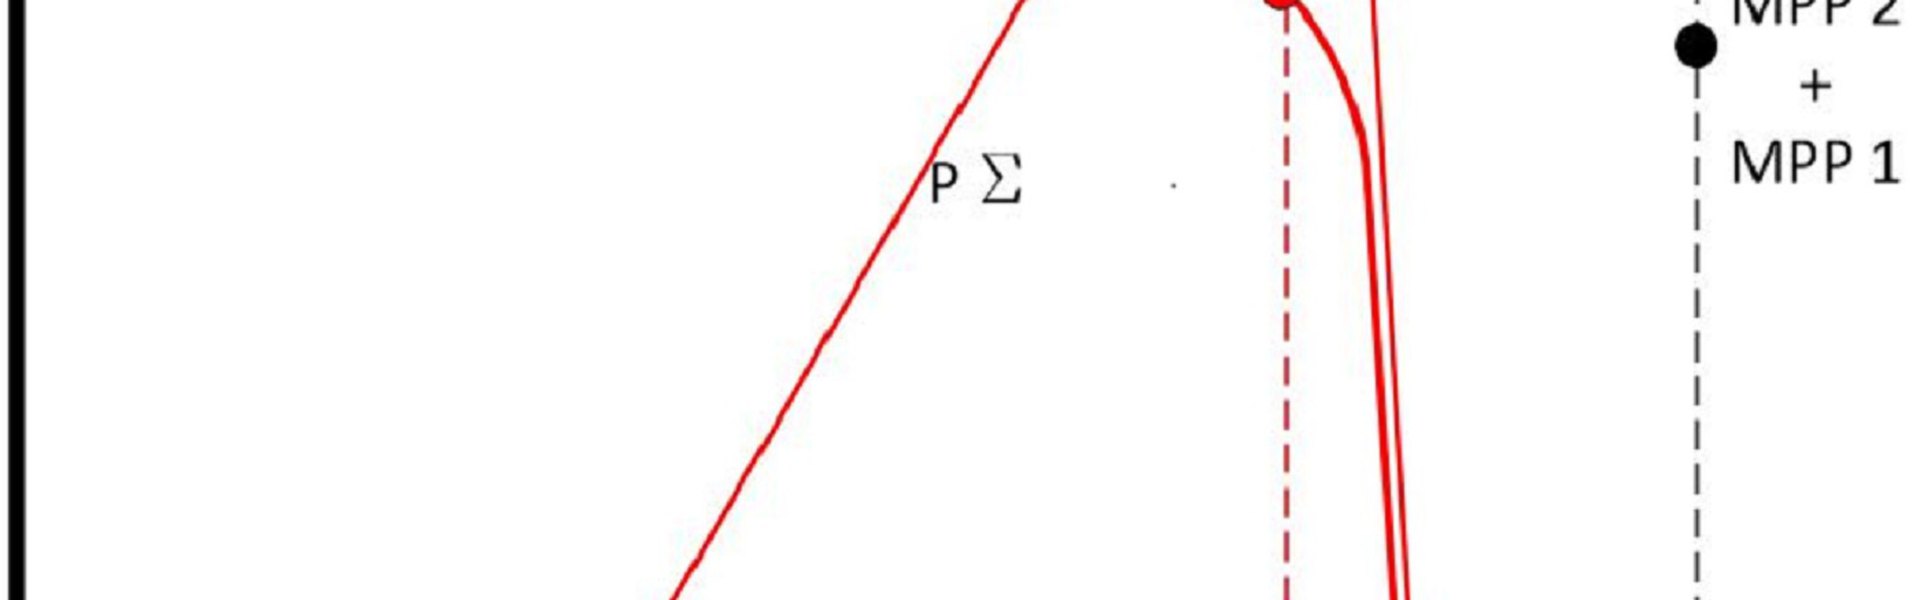
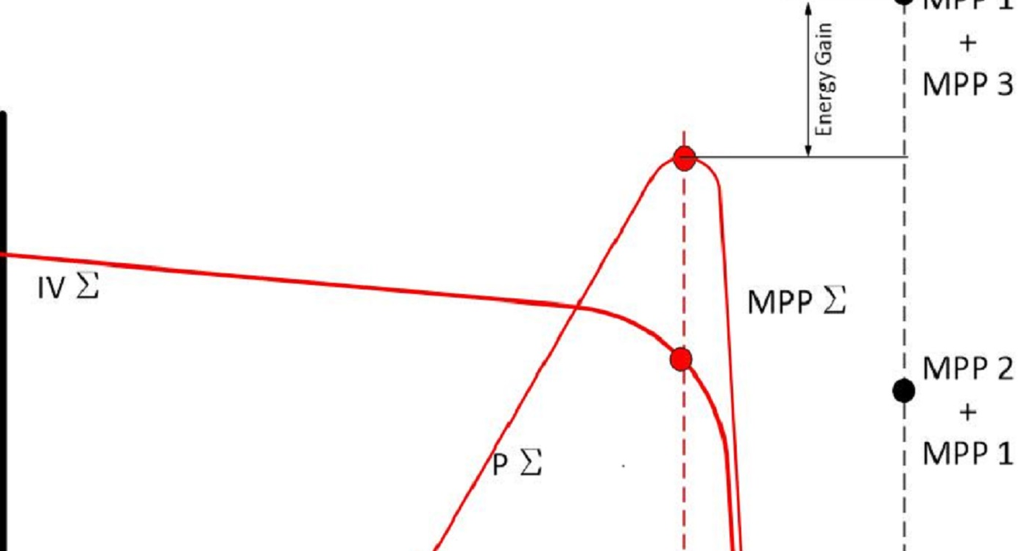
As mentioned above, there are different types of power electronics you can use to perform MPPT, each of which differs in the amount of “granularity” they offer. The most granular MPPT is offered by module level power electronics, i.e. devices that perform MPPT on individual PV panels. The next step up in granularity is offered by string level devices and finally the least granular MPPT is offered by central inverters. The question of which of these devices makes the most sense is highly impacted by the level of PV panel mismatch you can expect to see in this system. PV panel mismatch can be observed if the IV curves of either the different modules in a string or the different strings in an array vary. The worse the variance, the worse the mismatch, the better the results observed from more granular MPPT strategies. In the image beloe, you can see the energy gain that can be achieved by summing up individual MPPs with a granual approach over the average of the curves used in centralized, single MPPT approach.
So why would IV curves ever not match? After all, they look just fine on the PV panel spec sheets! IV curves can become mismatched for a variety of reasons. Some can be inherent to the system such as uneven shading. This is typically only an issue for rooftop systems, as you are not likely to build a large, ground mounted system in a shady area. Conversely, a residential system could have a variety of objects shading it which just cannot be removed. Then there’s the weather. Changing levels of cloud cover can distort MPPT curves as can different degrees of soiling on panels. Finally, over time, IV curves can diverge as a result of uneven panel degradation or when panels are damaged and replaced with different panels with fundamentally different IV curves.
IV Curve Tracing
The process of IV curve tracing can be a great way to see just how much the IV curves in your system. IV curve tracing is typically executed by plant operations and maintenance (O&M) personnel. This process is conducted using I-V curve tracers which are specialist types of test equipment that sweep an electrical load connected to the solar PV module or string and measure both the current and voltage at multiple points during the sweep. The pairs of current and voltage values are then used to plot an I-V curve directly or to calculate and plot a P-V curve.
One issue to watch out for with IV curve tracing is that is generally done under perfect conditions - minimal cloud cover, no shading and strong irradiance – so such tests might not detect transient mismatch conditions.
Improving PV Yield by Mitigating Mismatch with String Level Optimizers
Here at Alencon, our String Power Optimizer and Transmitter (the SPOT) can inject granular maximum power point tracking into a PV array connected to a central inverter. To help our customers and perspective customers understand what yield improvement they might stand to see by using our products, we have developed a predictive model of yield improvement based on the interpolation of IV curves. We analyze IV curves taken at your plant to help you understand what sort of performance improvement you might expect if retrofitting the SPOT into your PV plant.
A Word About Bi-Facial Panels
Of late, bi-facial panels, or panels that can generate power from both sides of the panel, are growing in in popularity. There could be tendency to assume such panels would be more subject to mismatch because the amount of irradiance that the back side the panel is less uniform than then front. While this is true, this uneven exposure to light does not in and of itself lead to MPP mismatch, as really this only varies the height of the IV curve, i.e. increases the current. The level of voltage at the MPP will not change. Where bi-facial panels will introduce significant mismatch is when they installed in PV arrays with standard PV panels.
The Opposite of MPPT - Curtailment
There are times when a PV plant is generating too much power. This can most typically occur during peek sun when a plant with a DC overbuild is generating more DC power than the inverter’s name plate power rating. It is also possible, too much energy is being put onto the grid and the grid operator wants to reduce – or curtail – the amount of power a plant is generating. In practical terms, curtailment is the exact opposite of MPPT. When power curtailment is desired, the voltage being loaded onto the strings moves off of the MPP. Typically, voltage is increased, since a small increase in voltage can lead to a much steeper drop in corresponding power, i.e. the right side of the power curve has a much steeper slope than the left side.